
File:BaldockFig3NEW2.jpg
From MarineSpecies Introduced Traits Wiki

Size of this preview: 800 × 487 pixels. Other resolutions: 320 × 195 pixels | 967 × 589 pixels.
Original file (967 × 589 pixels, file size: 50 KB, MIME type: image/jpeg)
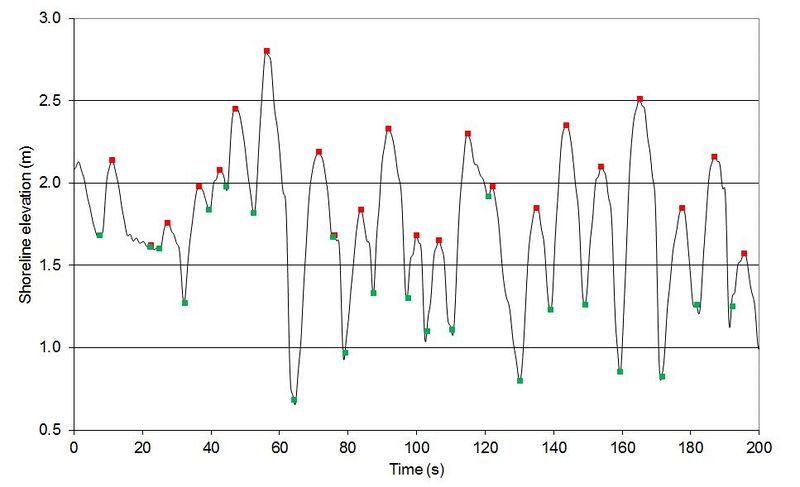
Typical pattern of bore-driven swash oscillations (vertical component). Data show shoreline elevation versus time at Avoca Beach, NSW. Red and green squares indicate maxima and minima of individual swash events. Data courtesy of Dr Michael Hughes, NSW Office of Environment and Heritage.
File history
Click on a date/time to view the file as it appeared at that time.
| Date/Time | Thumbnail | Dimensions | User | Comment | |
|---|---|---|---|---|---|
| current | 10:14, 31 May 2017 | | 967 × 589 (50 KB) | Dronkers J (talk | contribs) | Typical pattern of bore-driven swash oscillations (vertical component). Data show shoreline elevation versus time at Avoca Beach, NSW. Red and green squares indicate maxima and minima of individual swash events. Data courtesy of Dr Michael Hughes, NSW... |
- You cannot overwrite this file.
File usage
The following page links to this file:
