Deteriorated groynes
Problem definition
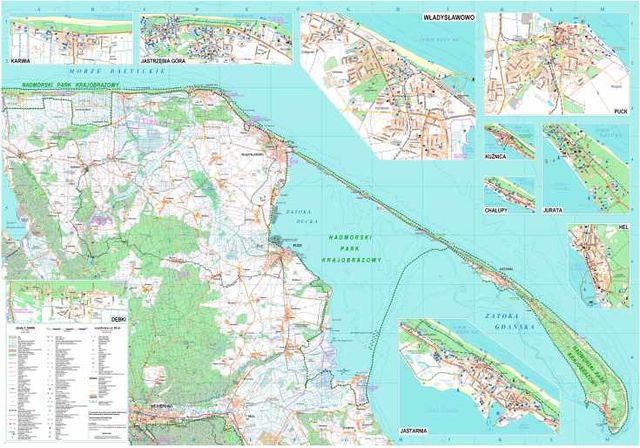
The process of deterioration of groynes reduces their efficiency as a coastal protection measure. On the other hand, artificial beach fills are often used together with groyne fields as a combined erosion control practice. In instances of aged groynes the residence time of beach fills and thus re-nourishment intervals can be (considerably) reduced. Therefore, the observations of long-term behavior of wooden palisade groynes at Hel Peninsula, Baltic Sea, Poland, see Fig. 1, can serve as a reference case for studies on coastal segments protected by ageing and deteriorating groynes with or without additional artificial beach nourishment.
Contents
Deterioration processes in wooden groynes
The groynes were constructed between 1946 and 1970 along 12 km from the root of Hel Peninsula. 162 groynes were built of which 114 were wooden and 46 reinforced concrete palisades. Gradual extension of the groyne field over almost 25 years was forced by the lee-side effect, producing irreversible damage of dunes. In 1989 large-scale beach nourishment program was initiated. It restored wide beaches and dunes and prevented the inundation of dune hinterland during storms having 100 years return period (1%). Nowadays, the central problem is the assessment if and to what extent the presence of deteriorating groynes contributes to the reduction of erosion rates of fill sediment.
The deterioration of wooden palisade groynes consists of combinations of the following processes:
- Breaking of (individual) piles mainly due to ice loads; sharp edges of broken piles can be dangerous to beach users.
- Tilting of insufficiently deep driven piles due to ice loads and/or wave action.
- Digging out of insufficiently deep driven piles by waves and currents. Usually, this type of damage follows an incorrect design assumption that water depths will not vary too much before and after construction of a groyne. When the groyne is completed temporary or permanent scours can emerge due to local changes in hydrodynamic regimes and seabed response. Seasonal seabed changes near a groyne can exceed 1 m [1]. If they coincide with long-term tendency toward seabed deepening, the resultant changes of depths can reach several meters. In such instances economic considerations should determine whether the piles should be longer and driven deeper or their periodic replenishment is a viable alternative.
- Decay of wooden pile cores, mainly by parasite fungi living along the whole pile length. Visible decay of piles becomes visible after 15 years of residence in water, after 15 - 25 years the rate of decay is significant, it then slows down between 25 - 40 years and accelerates again afterwards. This type of destruction takes place mainly above the practical decay limit, which was determined to be situated + 10 cm above the mean sea level. The weakened pile has a substantially reduced diameter and can be easily broken by external loads.
In groynes consisting of standard, neither pre-stressed nor post-tensioned, reinforced concrete units, the cracks are inherent, so direct contact with salt water triggers rapid corrosion of reinforcement. This results in quick and irreversible destruction of entire groynes; the concrete groynes at Hel Peninsula were destroyed in this way and their remnants had to be removed. Thus, wooden palisades turned out to be optimum solution from the economic (low cost and long-term operational use) as well as ecological (natural material) point of view. Also, the palisades always have certain permeability, which decreases undesired rip currents that may emerge in compartments formed by impervious groynes and be dangerous for swimmers. The most popular and natural material in Baltic Sea countries are pine tree trunks; more expensive oak tree trunks are also applied eg. on the Dutch coast; local experience usually provides sufficient clues for the suitable choice of wood for groyne palisades.
The deterioration processes change the efficiency of groyne fields and exert impacts on the adjacent shoreline. The resultant effects can include:
- The failure of a certain number of piles results either in the loss of groyne continuity or its shortening,
- Failures of single piles along a considerable portion of groyne length or even the whole length only increase the structure’s permeability and do not contribute considerably to changes of shoreline configuration; it may be even advantageous for a perfectly non-permeable groyne,
- Failure of 2-5 adjacent piles produces increased water flows through the gap; this leads to intensified seabed erosion in that area, so this condition is disadvantageous,
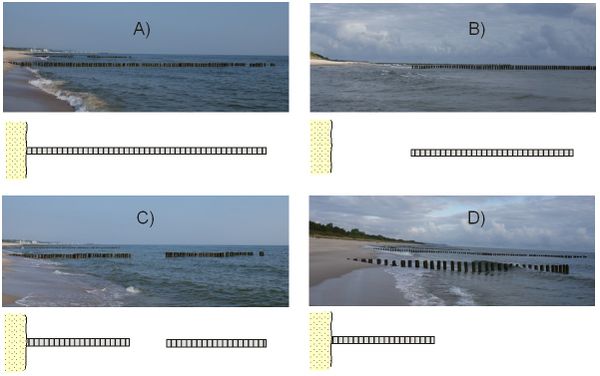
- Greater gaps of several meters result in greater seabed erosion. If they occur near a groyne tip the whole structure has a reduced length and the resulting seabed erosion affects mainly the nearest (remaining) piles and occurs relatively far from the shoreline. If such gaps develop close to the root of the groyne the resulting seabed erosion is very disadvantageous, because of the loss of structure – shoreline contact. Next, the alongshore current is concentrated in that gap, so relatively large water velocity is generated there that leads to rapid development of a large scour. A photo of a ‘healthy’ groyne and those with gaps in various sections are presented in Fig. 2.
Groyne - beach interactions assessed by numerical simulations
Local conditions at Hel Peninsula
Hel Peninsula is located on the Polish Baltic Sea sandy coast. It is a long, sandy spit that emerged when islands, which now feature its wide, seawardmost part were connected by a delicate, narrow sandy strip, made of sediment eroded from nearby cliffs. This formation was naturally nourished by longshore sediment transport, running predominantly from west to east. In past centuries this system was often breached by heavy storms, but due to low population and insignificant economic impact it was then not regarded as disturbance. The Peninsula was stabilized artificially by planting pine trees in the 2nd half of the 19th century. The erection of railway line from Władysławowo at the root to Hel town at the tip and the construction of a parallel road provided communication routes with the mainland. Simultaneously, it highlighted the growing exposure of local communities to the consequences of breaching.Long-term records indicate that for average storms, the significant wave height outside the surf zone (in water depth h of about 20 m) usually reaches Hs = 2–2.5 m with a mean period of T = 5–7 s. The incoming wave energy is dissipated due to wave transformation and breaking as the waves propagate onshore. In the absence of tides waves are the only source of energy; their breaking produces wave-driven currents that govern alongshore and on- and offshore sediment migration. The basic sediment characteristic is its average diameter. It is equal to ca. 0.2 mm, which is typical for south Baltic Sea beaches.
A serious disturbance of sediment transport occurred when a harbor at Władysławowo was constructed in 1937 – 1939. Erected at the root of the Peninsula, it temporarily blocked alongshore, down drift natural delivery of sediment. This started lee-side erosion in immediate down drift neighbourhood of the harbor. The response of coastal managers was the development of the studied groyne field in 1946 onwards. Later, the harbor received a dredger to re-create natural sediment migration through the navigational channel (bypassing system) by placing the dredged sand near the groyne field in order to alleviate erosion threats. However, global climatic changes, manifested by sea level rise and the growth of storminess at the end of 20th century found those measures insufficient, so apart from harbor sediment bypassing system, massive artificial beach fills, extending up to 20 km from the root, were initiated.
Numerical model and boundary conditions
Numerical simulations, aimed at the assessment of groyne deterioration patterns on adjacent, nourished beach were executed using the Dutch DELFT 3D package. This package is a 3-D model that allows for computations of transient water flows and sediment transport; hydrodynamic forcings can include riverine flows, wind driven (drift) currents, flows due to differences in water table elevation (gradient currents), density flows driven by changes in water temperature or salinity and finally tidal and wave driven currents. The following computational modules were incorporated into the simulations: (1) FLOW module that computes hydrodynamic flow regimes, (2) WAVE module calculating the wave parameters, (3) SED module calculating the sediment transport and seabed changes.
The water column was schematized by 10 computational layers; the thickness of the near-bottom layer was defined as 2.3% of seabed depth at a given grid point. The sediment transport was determined using van Rijn formula [2]; the associated near-bed and near-groyne layer stresses were calculated according to Fredsoe, 1984 [3]. Also, it was assumed that storm waves cannot spill over the top of the groyne and the coefficients of transmission and reflection are both equal 0.5. For this schematization the following boundary conditions were assumed:
- the groyne length was set to 60 m for all groynes, which corresponds to the average groyne length, measured from the shoreline,
- the distance between consecutive groynes was set to 90 m,
- the modelled coastal segment measured 500 m in the alongshore direction and stretched 1200 m offshore,
- the grid points between the groynes and up to 200 m offshore were spaced every 5m, outside that area (up to 1200 m offshore) the spacing was set to 15 m,
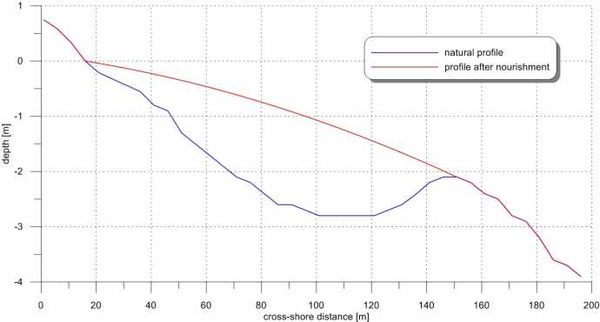
- the bathymetric profile, presented in Fig. 3, was adopted for the whole modelled area; this profile features characteristic elements of near-shore bathymetry along the Hel Peninsula.
Results of numerical simulations
The computations of flow fields were done for typical stormy conditions in which, as shown by [4], the significant wave height corresponding to mean wave energy is approximately equal to (Hs)mean [math]\approx[/math] 0,9÷1m. Thus, the following input wave parameters were adopted at the offshore limit of computational domain:
- significant wave height Hs = 1.0 m,
- wave peak period Tp = 4.0 s,
- azimuth of wave approach Az = 315°.
Four cases were considered for the calculation of flow fields between the groynes:
- full groyne length,
- groynes without contact with shore; gap length: 1/3 of full groyne length,
- groynes with gap in the middle section: gap length: 1/3 of full groyne length,
- groynes shortened by 1/3 of full groyne length.
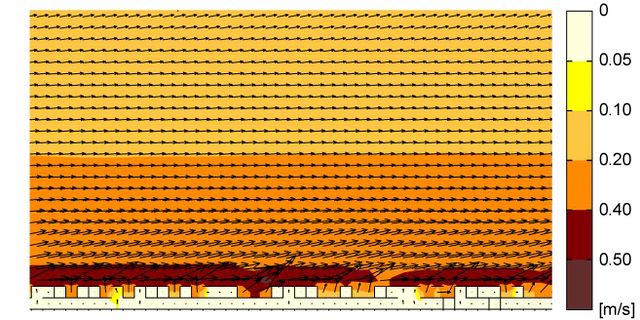
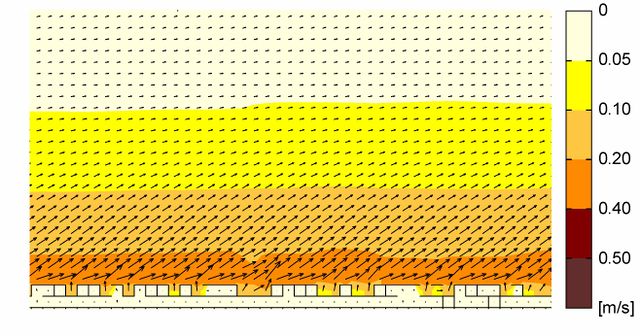
Fig. 4 presents the case without groynes. We can clearly see alongshore water flows; for depth-averaged flows 3 strips are vividly present, whereas for near-bed flows we can distinguish 4 strips. The widths of these strips and the associated velocities are presented in Tab. 1. Given the average diameter of sand that builds the Hel Peninsula as D50 = 0.15÷0.25 mm, the initiation of sediment motion occurs for water velocities of 0.08÷0.10 m/s, whereas the mass movement is achieved at 0.2÷0.4 m/s. Thus, when the water velocities exceed 0.2 m/s it is assumed that sediment transport is an important process. Comparing this velocity with those from Tab. 1 we can see that mass bedload and suspended sediment transport develops during average storms in near shoreline proximity.
| Strip | Depth averaged velocities | Near-bed velocities | ||
| Strip width | Velocity range | Strip width | Velocity range | |
| Strip I – innermost | ~ 10 m | 0.4÷0.5 m/s | ~ 15 m | 0.2÷0.4 m/s |
| II | ~ 50 m | 0.2÷0.4 m/s | ~ 20 m | 0.1÷0.2 m/s |
| III | ~ 60 m | 0.1÷0.2 m/s | ~ 40 m | 0.05÷0.1 m/s |
| Strip IV –offshore most | ~ 40 m | 0.00÷0.05 m/s | ||
Tab. 1) Distribution of nearshore flow velocities for beach without groynes
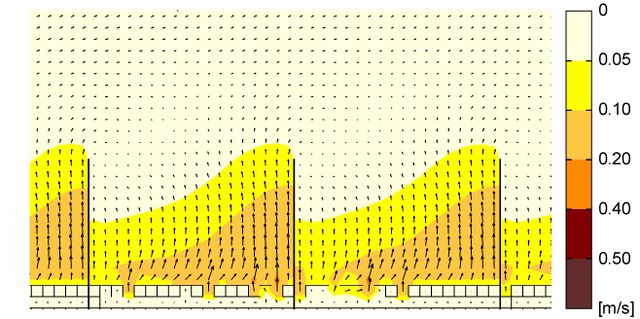
The case with fully operational groyne is presented in Fig. 5. When compared with un-engineered case it can be seen that water velocities between the groynes are much lower. In close shoreline proximity maximum values of water velocities fall between 0.1÷0.2 m/s, for greater offshore distances they do not exceed 0.1 m/s for both depth averaged and near-bed case. Outside groynes, at the strip adjacent to groyne tips, water velocities reach 0.05÷01 m/s, which means they are still lower than for un-engineered beach. The slowing effect of groynes disappears as far as 80÷90 m offshore and long shore water velocities beyond that distance are identical to those for un-engineered beach (cf. Fig. 4). From Fig. 5 we can therefore conclude that substantial decrease of water velocities in compartments formed by fully operational groynes largely contributes to significant reduction of sediment transport during storms. This can serve as justification for applications of groynes as beach stabilization measure.
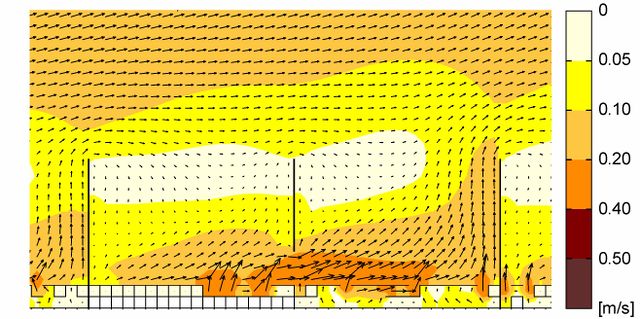
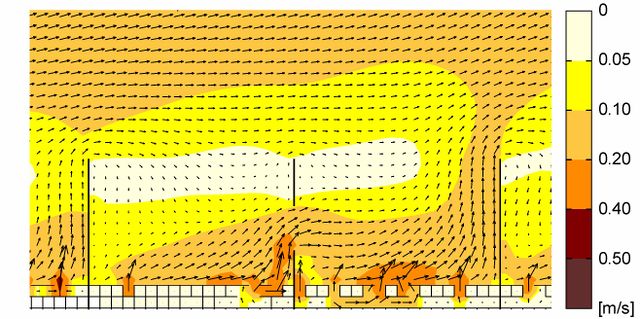
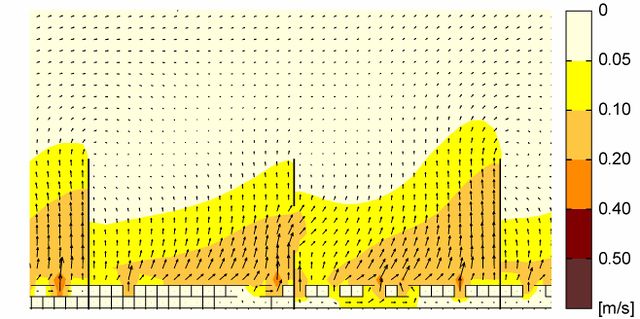
Fig. 6 shows water velocities for a situation, where the middle groyne lost 1/3 of its length at the root, while the neighboring groynes remained fully operational. The comparison of water velocities near the damaged groyne and near the fully operational middle groyne in Fig. 6 shows that water velocities in the damaged area are greater, particularly in the downdrift section. Maximum depth-averaged velocities there fall between 0.2÷0.4 m/s, while their near-bed counterpart reach 0.1÷0.2 m/s. Fig. 6 clearly demonstrates that the longshore current, formed in the gap, will be eroding the beach and carry away the sediment partly outside the compartment between the middle and right (downdrift) groyne.
The comparison with un-engineered beach shows that the loss of contact between the shoreline and the groyne is much more dangerous for the beach stability than leaving it unprotected. The major reason for this is that the emergence of a gap near the shoreline results in offshore sediment migration, whereas for un-engineered beach the sediment transport is directed predominantly in the alongshore direction.
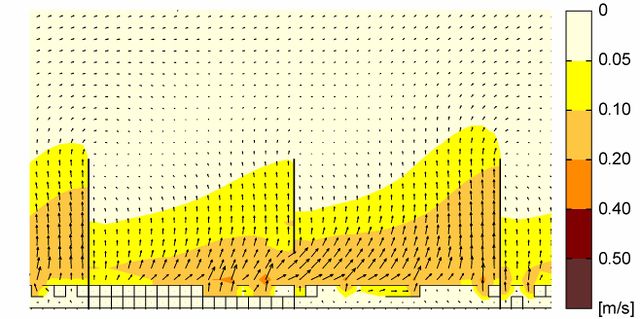
Fig. 7 demonstrates the distribution of water velocities for the case where the middle section of the middle groyne is broken along 1/3 of the groyne length. We can see a similarity with the previous case (lost contact with the shoreline) as to the direction of water flows but in general the velocities themselves are smaller. Only locally depth-averaged flows fall between 0.2÷0.4 m/s; in most shoreline-adjacent locations they usually reach the speeds between 0.1÷0.2 m/s. Also the near-bed velocities never exceed 0.2 m/s.
As regards the sediment transport, we can see a certain resemblance with Fig. 5 i.e. the case of the ‘detached’ groyne. In both of them the sediment will be showing offshore downdrift migration tendencies first toward the next, fully operational groyne and then offshore along that groyne. However, we should expect that due to lower water velocities for the gap developing in the middle section, the intensity of sediment transport for that case will be lower too.
The 3rd type of groyne damage is presented by Fig. 8. It features a middle groyne whose tip is cut by 1/3 of the groyne length and framed by two fully operational groynes. Compared with the previous case (middle section gap in the middle groyne) we can say that directions of water flows are similar. Importantly, the speeds in close shoreline proximity are lower and do not exceed 0.2 m/s for both depth-averaged and near-bed case. The offshore current, generated along the shortened groyne will produce offshore sediment migration and then deposition after having passed the shortened tip. Thus, the intensity of beach erosion will be substantially lower than for the case of no groyne - shoreline contact.
Assessment of groyne impact on fill residence time
The 2nd phase of numerical simulations was concentrated on the assessment of fill residence time with and without the presence of groynes. The basic assumption for the simulations is that the area of three consecutive groynes was filled by 30,000 m³ of sand with D50 = 0.22 mm. The resulting post-nourishment seabed configuration is shown in Fig. 2. Also, the same fill volume and the same post-nourishment seabed configuration were assumed for un-engineered beach. All simulations were executed for three stormy conditions:
- average, typical storms: Hs = 1.0 m, Tp = 4.0 s, Az = 315 °,
- moderate storms: Hs = 1.5 m, Tp = 5.0 s, Az = 315 °,
- heavy storms: Hs = 2.0 m, Tp = 6.0 s, Az = 315 °.
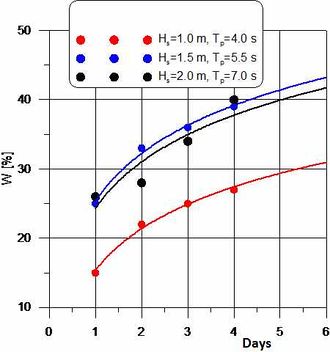
Results of the simulations are shown in Fig. 9. They represent changes of the amount of sediment volume that remained in the area of two groyne compartments, that is the surface of 60 x (2.90)=1800 m², relative to the amount of remaining sediment in the same un-engineered area. This is expressed by the coefficient W and expressed as:
In this expression Qgroyne - is the volume of sediment lost from two groyne compartments at time t (days) and Qbeach - is the corresponding volume of sediment lost from that area when no groynes are present. Thus, when W > 1 the amount of sediment washed away from groyne compartments is less than for un-engineered beach, so the groynes contribute to beach stability.
The results of simulations provide evidence that the fill resides longer in the nourished region in the presence of groynes. After 4 days of continuous stormy conditions the amount of fill sediment remaining in the nourished area is 30 – 40% greater when the groynes are present. Importantly, the percentage of remaining sediment is greater for heavier storms.
Conclusions
- For average storms and fully operational groynes, water velocities in groyne compartments are much lower than for un-engineered beach. Mass sediment migration is prevented.
- For the cases of damaged groynes the numerical simulations provide evidence that the greatest intensification of beach erosion occurs when the groyne lost contact with the shore. For average storms water velocities in the gap are high enough to trigger intensive sediment migration and rapid scour development.
- Groynes that lost contact with the shore are much worse for the beach stability than the beach without any protection.
- When a groyne has a gap in the middle section additional sediment migration develops as well but is substantially less intensive than in the case of no shore-groyne contact.
- For groynes damaged near the tip additional sediment migration is also visible but will be less intensive than for the case when a damage forms in the middle section and much less intensive than for the case of no shore-groyne contact.
- Fully operational groynes increase the effectiveness of beach nourishment. Based on the numerical simulations, the average increase of residence time due to the presence of groynes is ca. 30%.
See Also
- Groyne
- Groynes
- Groynes as shore protection
- Shore nourishment
- Dealing with coastal erosion
- Gravel Beaches
References
- ↑ Basiński T. (1998). Ergebnisse des Forschungsvorhabens „Wirkungsweise von Einbauten in See” – Synthese, Leichtweiss-Institut für Wasserbau. Technische Universität Braunschweig. (Internal Report).
- ↑ Van Rijn L.C. (1993). Principles of sediment transport in rivers, estuaries and coastal seas. Aqua Publications, the Netherlands.
- ↑ Fredsoe J. (1984). Turbulent boundary layer in wave-current interaction. Journal of Hydraulic Engineering ASCE, Vol. 110, pp. 1103-1120.
- ↑ Pruszak Z., Ostrowski R., Skaja M., Szmytkiewicz M. (2000). Wave climate and large-scale coastal processes in terms of Boundary conditions. Coastal Engineering Vol 42, No. 1, 31-56.
With contributions by: Tadeusz Basinski, Rafal Ostrowski, Zbigniew Pruszak, Jan Schöhnofer, Marek Skaja, Piotr Szmytkiewicz and Marek Szmytkiewicz
|

