Statistical description of wave parameters
Because of the random nature of natural waves, a statistical description of the waves is normally always used. The individual wave heights often follow the Rayleigh-distribution. Statistical wave parameters are calculated based on this distribution. The most commonly used variables in coastal engineering are:
Fig 5.7
Time-series of individual waves or surface elevations
- The significant wave height, Hs, is the mean of the highest third of the waves in a time-series of waves representing a certain sea state. This corresponds well with the average height of the highest waves in a wave group. Hs computed on the basis of a spectrum, is referred to as Hm0.
- The mean wave period, Tm, is the mean of all wave periods in a time-series representing a certain sea state.
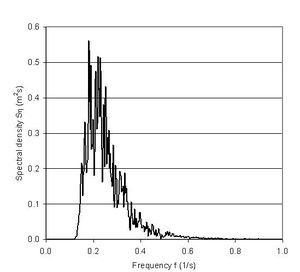
- The peak wave period, Tp, is the wave period with the highest energy. The analysis of the distribution of the wave energy as a function of wave frequency (period-1) for a time-series of individual waves is referred to as a spectral analysis. Wind wave periods (frequencies) often follow the so-called JONSWAP and Pierson-Moskowitz spectra. The peak wave period is extracted from the spectra. As a rule of thumb the following relation can be used: Tp ~ 5.3 Hm01/2.
- The mean wave direction, m, which is defined as the mean of all the individual wave directions in a time-series representing a certain sea state.
These parameters are often calculated from continuous or periodic time-series of the surface elevations; typically the parameters are calculated once every one or three hours, whereby a new discrete time-series of the statistical wave parameters is constructed. This time-series is thereafter analysed statistically to arrive at a condensed description of the wave conditions as follows:
- Wave height distribution represented by Hs vs. percentage of exceedence. This often follows a Weilbull-distribution
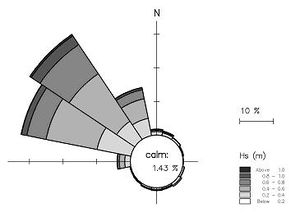
- Directional distribution of the wave heights, which is often presented in the form of a wave rose
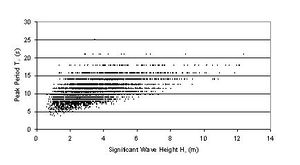
- Scatter diagram of Tp vs. Hs
Fig 5.8
Wave spectrum: Hm0=1m, T02=3.55s, Tp=5s (corresponding to peak frequency of 0.2 s-1)
Analyses of extreme wave conditions are performed on the basis of max. wave heights in single storm events or on the basis of annual max. wave heights. These analyses are often presented as exceedence probability vs. wave heights.
Fig 5.9a
Wave height duration exceedence distribution; example from Rødsand, Denmark.
Fig 5.9b
Wave Rose; example from Malacca Strait.
Fig 5.9c
Scatter diagram, Tp vs. Hs, Faroe Islands.
Fig 5.9d
Extreme value analysis of wave height; threshold value = 2 m, Weibull distribution.


