File:BaldockFig9.jpg
From MarineSpecies Introduced Traits Wiki

Size of this preview: 749 × 600 pixels. Other resolutions: 300 × 240 pixels | 762 × 610 pixels.
Original file (762 × 610 pixels, file size: 56 KB, MIME type: image/jpeg)
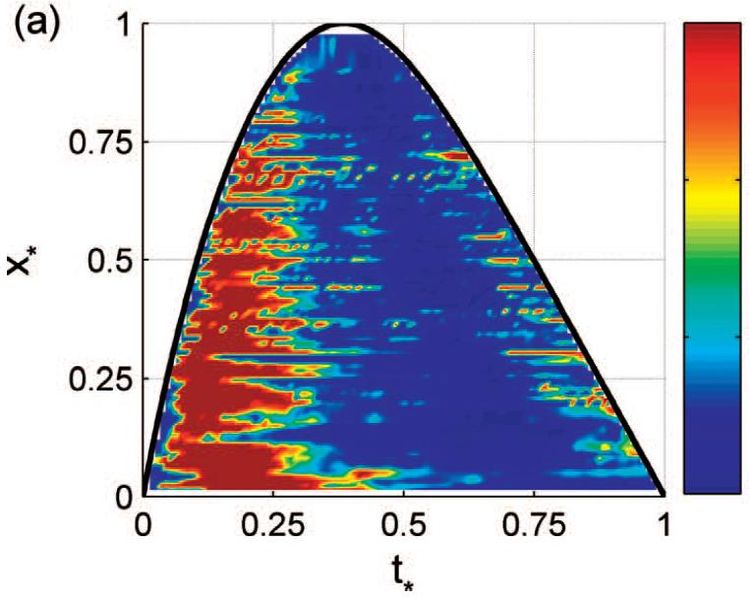
Measured normalized suspended sediment concentration indicated by colours mapped onto the normalised x*-t* plane representing the swash excursion and duration. Source: Hughes, M. G., T. Aagaard and T. E. Baldock, 2007. Suspended sediment in the swash zone: Heuristic analysis of spatial and temporal variations in concentration. Journal of Coastal Research 23: 1345-1354. Reproduced with permission of the Coastal Education and Research Foundation, Inc.
File history
Click on a date/time to view the file as it appeared at that time.
| Date/Time | Thumbnail | Dimensions | User | Comment | |
|---|---|---|---|---|---|
| current | 09:21, 30 May 2017 | | 762 × 610 (56 KB) | Dronkers J (talk | contribs) | Measured normalized suspended sediment concentration indicated by colours mapped onto the normalised x*-t* plane representing the swash excursion and duration. From: Hughes, M. G., T. Aagaard and T. E. Baldock, 2007. Suspended sediment in the swash zon... |
- You cannot overwrite this file.
File usage
The following page links to this file:
