River tides
The general characteristics of tidal rivers are described in the article Tidal rivers. This article is concerned with the characteristics of tidal propagation.
Contents
Why river tides matter
The issue of tidal propagation is important for several reasons:
- The tide often yields a major contribution to high water levels and to the associated risk of flooding. This is especially the case when the mean water level is raised by an exceptional river discharge or by a storm surge at the estuarine mouth. The tide is therefore an important factor in the design and maintenance of flood defenses.
- The tide often plays a major role in processes of sedimentation and erosion. It therefore influences the navigable depth and the management strategies (e.g. dredging) to maintain the fairway.
- The tide enables the exchange of water, dissolved and particulate material and organisms between the river and adjacent wetlands. The tide therefore contributes to improving water quality and to ecological diversity of the fluvial ecosystem, by offering a unique habitat for many species.
If the downstream estuary is not closed off by a weir or a dam, the tidal wave penetrates much further inland than the seawater, see the article Tidal rivers. The penetration length depends primarily on the river discharge and the tidal amplitude at the river mouth (i.e. the head of the estuary). Frictional damping is the main process limiting tidal intrusion. Other factors limiting tidal intrusion are:
- the presence of a weir or a dam where the tidal wave is reflected,
- a runoff speed which is higher than the tidal wave propagation speed.
In practice, a tidal wave generally does not propagate upstream beyond the location where the river bed level exceeds the mean water level at the river mouth. This is not because the waves cannot run up the slope, but rather because friction is always strong in the upstream part of the tidal river [1].
River channel deepening
Many tidal rivers have seaports located far inland. Modern maritime traffic requires deep fairways, which are created by dredging of the natural tidal channels. Shoals are removed, channels are excavated and maintained at necessary depth by dredging and by structures such as training walls and groins.
These interventions have several consequences:
- Increase in tidal range, illustrated in Fig. 1 for several dredged tidal rivers in Europe. Deepening and smoothing the fairway, removing sills, beams and other turbulence-creating bedforms reduces frictional damping of the tidal wave. Frictional damping is further reduced as greater water depth promotes salinity and mud stratification of the water column (see Estuarine turbidity maximum).
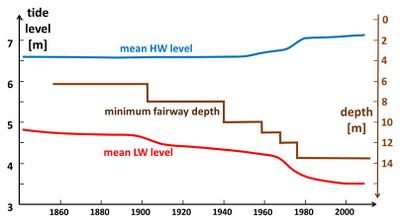
- Increased risk of flooding when storm surge set-up coincides with springtide. The increase of tidal range mainly corresponds to a lowering of the LW tide level, as illustrated in Fig. 2 for the Elbe tidal river. The increase of the HW tide level is therefore modest in comparison to the downward shift of the LW level. Besides, channel deepening reduces the sensitivity of high water levels in the tidal river to high river runoff events[2]. In microtidal environments, this can lead to a lower risk of flooding in case of extreme river discharge[3].
- Increased seawater intrusion; the salinity limit is moved inland. The river runoff velocities are decreased due to the greater depth while tidal current velocities are strengthened due to reduced frictional damping. The greater tidal excursion and stronger estuarine circulation bring seawater further inland.
- Trapping of fine sediment further upstream in the tidal river as river runoff velocities are reduced and tidal currents strengthened. Moreover, flood dominance associated with tidal asymmetry is enhanced because channel deepening increases the tidal asymmetry component M4 to a similar extent as the tidal range[2]. Fluid mud layers can form during periods of neap tide and slack water. The positive feedback between tidal amplification and mud stratification can lead to hyperturbidity, as observed in the Ems tidal river[4]. In many dredged tidal rivers (e.g. Ems, Gironde, Humber), the turbidity maximum moves far upstream into the freshwater zone during periods of low river discharge[5][6]. More detailed explanations are given in the article Estuarine turbidity maximum.
 Fig. 1. Increase in tidal range at inland seaports on tidal rivers in Europe over the past century. The increase in tidal range is the result of interventions aimed at creating deep and smooth channels for shipping traffic. Adapted from Winterwerp (2013[7]). |
 Fig. 2. Evolution of the HW and LW tidal levels in the Elbe River at Hamburg in response to channel deepening in the past century. Adapted from ABP mer (2011[8]). |
Tide-induced water level set-up
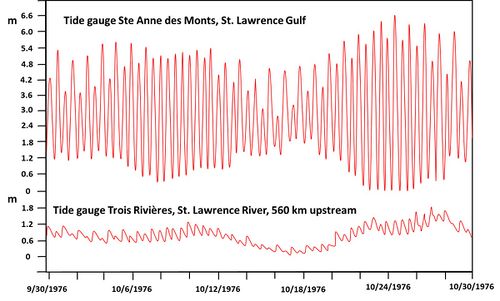
Several characteristics of tidal wave propagation in tidal rivers are illustrated in Fig. 3 that refers to the St. Lawrence River in Canada. Remarkable features are:
- the huge distance along the river over which the tide has a significant influence on water levels,
- the correlation between the tidal amplitude at the river mouth and the water level set-up upstream,
- the upstream distortion of the tide, with a fast tidal rise and a slow fall.

The St. Lawrence river follows a seismically active rift valley that surfaced after the last glacial period. The great tidal intrusion length is primarily due to the small bed slope of only a few meters per 100 km in the downstream river reach and the substantial water depth that exceeds 10 m in many places.
The tide plays an important role in the upstream net water level set-up. During spring tide, much of the set-up is due to the nonlinear nature of frictional momentum dissipation (i.e. the second term in the right-hand side of Eq. (A1), which is not a linear function of the discharge). The nonlinear frictional momentum dissipation transfers tidal momentum to a residual pressure gradient that creates a water level slope. Transfer of tidal momentum to a residual pressure gradient also occurs due to the nonlinear nature of momentum advection in the tidal momentum balance (second term in the left-hand side of Eq. (A1)). These two nonlinear flow processes are responsible for the smaller net water level set-up at the gauge station Trois-Rivières during neap tide compared to the larger set-up during spring tide. A more detailed explanation is given in appendix A. Part of the water level set-up is further related to the water level slope needed to transmit the river runoff trough the tidal river.
Tidal asymmetry

The tidal records displayed in Figs. 3 and 4 show that the sinusoidal character of the tide is progressively lost when moving upstream along the tidal river. Tidal rise is faster and tidal fall is slower. This means that the flood component of the total discharge is a strong short pulse in comparison to the ebb component. The development of this type of tidal asymmetry is a common feature of tidal propagation in tidal rivers. It is related to the faster propagation of the high water (HW) crest of the tidal wave compared to the slower propagation of the low water (LW) trough of the tidal wave. An explanation is given in appendix C. A similar process also occurs in estuaries, see for example Tidal asymmetry and tidal inlet morphodynamics.
Tidal asymmetry is an important phenomenon for sediment transport in tidal rivers, especially in the downstream part of the tidal river during spring tides, when the maximum flood discharge exceeds the river discharge[11]. The strong current associated with the short flood pulse can mobilize and carry more sediment than the weaker ebb current, even in the presence of residual downstream runoff. In many cases this results in a sediment convergence zone downstream of the site where the sediment transport capacity of the flood current is overturned by the transport capacity of the combined ebb current and river discharge. This sediment convergence zone corresponds to the so-called estuarine turbidity maximum and is generally located around the transition between estuary and tidal river. In periods of low river discharge and spring tide, fine sediment particles can be transported upstream over a long distance by tidal asymmetry. For example, fine sediments of marine origin have been found in the docks of Rouen, 80 km upstream from the seawater intrusion limit[12]. Deposits of fine marine sediments have also been found in the fresh water reach of the tidal Scheldt river[13].
Appendix A: Influence of friction on tidal propagation
We consider tidal rivers that are not bounded by a weir or a dam. The tide can propagate upstream till it has faded by frictional damping. Important characteristics of the tidal influence on the water level variation in tidal rivers can be derived from the equations describing the tidal wave propagation. These equations express the momentum balance
[math]acceleration + inertia = pressure \; gradient - friction[/math]
and the volume (or mass) balance
[math]volume \; change = water \; transport \; gradient [/math] .
The corresponding formulas are
[math]\Large\frac{\partial Q}{\partial t}\normalsize + u \, \Large\frac{\partial Q}{\partial x}\normalsize = -gA \, \Large\frac{\partial \zeta}{\partial x}\normalsize - \Large\frac{c_D}{HA}\normalsize Q |Q| \qquad (A1) \quad[/math] and [math]\quad b \, \Large\frac{\partial \zeta}{\partial x}\normalsize = - \Large\frac{\partial Q}{\partial x}\normalsize . \qquad (A2)[/math]
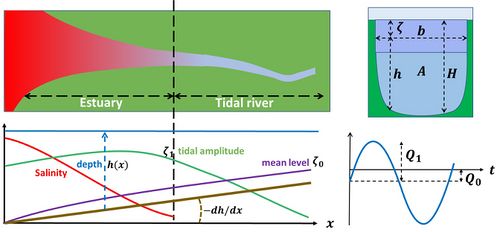
Meaning of the symbols (see Fig. A1):
[math]Q(x,t)[/math] is the water discharge at time [math]t[/math] through a river cross-section with area [math]A(x,t)=b(x)H(x,t)[/math] at distance [math]x[/math] from the seaward boundary, [math]b(x)[/math] is the average cross-section width and [math]H(x,t)=h(x)+\zeta(x,t)[/math] is the water depth, [math]\zeta(x,t)[/math] is the water level with respect to a horizontal datum, [math]u(x,t)=Q/A[/math] is the average current velocity in the cross-section, [math]c_D[/math] is the friction coefficient (typically of order 0.003) and [math]g[/math] is the gravitational acceleration. The equations (A1) et (A2) are simplified expressions; major assumptions are: the cross-sectional variation of the velocity [math]u[/math] can be ignored, and the shape of the cross-section [math]A[/math] can be approximated by a rectangle.
In tidal rivers, the terms in the right-hand side of Eq. (A1) are usually much larger than the terms in the left-hand side[9]. The momentum balance can then be approximated by
[math] gA \, \Large\frac{\partial \zeta}{\partial x}\normalsize =- \Large\frac{c_D}{HA}\normalsize Q |Q| . \qquad (A3)[/math]
We consider a horizontal tide [math]Q(x,t)[/math] with a single component of radial frequency [math]\omega[/math],
[math]Q(x,t) = -Q_0 (x) + Q_1 (x) \cos \theta, \quad \zeta (x,t) = \zeta_0 (x) + \zeta_1 (x) \cos (\theta + \psi(x)) \, + h.h. \, , \quad \theta = \omega t + \phi(x) , \qquad (A4)[/math]
where [math]h.h.[/math] stands for terms of higher harmonic order. There is no weir or dam where the tidal wave is reflected. Sufficiently far upstream (large positive [math]x[/math]), the fluvial discharge [math]Q_0[/math] is larger than the maximum tidal discharge [math]Q_1[/math]. In this case the friction term is given by
[math] - \Large\frac{c_D}{HA}\normalsize Q |Q| = \Large\frac{c_D}{HA}\normalsize Q^2 = \Large\frac{c_D}{HA}\normalsize \Big( Q_0^2 + \frac{1}{2} Q_1^2 - 2 Q_0 Q_1 \cos \theta + \frac{1}{2} Q_1^2 \cos 2 \theta \Big) = gA \, \Large\frac{\partial \zeta}{\partial x}\normalsize . \qquad (A5)[/math]
In the case of strong friction, due to the [math]\frac{1}{2} Q_1^2 [/math]-term, a steep water level slope [math]\Large\frac{\partial \zeta_0}{\partial x}\normalsize [/math] is required to enable the net runoff [math]Q_0[/math]. This implies that the mean height of the upstream water level [math]\zeta_0(x)[/math] is positively correlated with the tidal amplitude at the river mouth.
The term [math]-2 Q_0 Q_1 \cos \theta[/math] produces a negative gradient [math]\Large\frac{\partial \zeta_1}{\partial x}\normalsize [/math] and therefore dampens the tidal component of the upstream water level. Equation (A5) also shows that the friction generates a higher harmonic tidal component through the term [math]\frac{1}{2} Q_1^2 \cos(2 \theta)[/math].
A similar tidal influence on riverine water levels occurs when [math]Q_1 \gt Q_0[/math]. The mathematical development of the friction term is more complicated in this case, see Appendix B.
The contributions of the friction term to the mean upstream water level (through the mean water level slope [math]\Large\frac{\partial \zeta_0}{\partial x}\normalsize [/math]), to the principal tidal component [math]\zeta_1[/math] and to higher tidal components are shown in Fig. A1 as a function of the relative strength of the fluvial discharge, [math]Q_0/Q_1[/math]. The friction and pressure terms are developed in harmonic components of successive order, and Eq. (A3) is rewritten as
[math]Q |Q| = Q_1^2 \big( f_0 + f_1 \cos \theta + f_2 \cos 2 \theta + f_3 \cos 3 \theta \big) = - \Large\frac{gHA^2}{c_D}\normalsize \, \Large\frac{\partial \zeta}{\partial x}\normalsize = - \Large\frac{gHA^2}{c_D}\normalsize \, \Big(\Large\frac{\partial \zeta_0}{\partial x}\normalsize + \Large\frac{\partial}{\partial x}\normalsize (\zeta_1 \cos( \theta +\psi)) + h.h. \, \Big). \qquad (A6)[/math]
For a given value of the maximum tidal discharge [math]Q_1[/math], the term [math]f_1[/math] represents the influence of the fluvial discharge [math]Q_0[/math] on the damping of the upstream tidal amplitude [math]\zeta_1[/math]. Figure A3 shows that for values of [math]Q_0 \gt \frac{1}{2} Q_1[/math], the damping increases linearly with [math]Q_0[/math]. In contrast, no strong higher harmonic tides [math]\zeta_2[/math] and [math]\zeta_3[/math] are generated by the fluvial discharge.
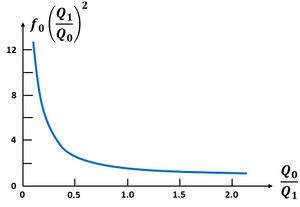
For a given fluvial discharge [math]Q_0[/math], the mean water level slope [math]\Large\frac{\partial \zeta_0}{\partial x}\normalsize [/math] is proportional to [math]-f_0 Q_1^2/Q_0^2[/math]. This proportionality is shown in Fig. A2 as a function of [math]Q_0/Q_1[/math]. This figure shows that the upstream water level increase is strongly enhanced when the tidal discharge [math]Q_1[/math] increases compared to the fluvial discharge [math]Q_0[/math].
In conclusion, whilst the tidal amplitude is strongly damped in the case of large fluvial discharge, this decrease of the tidal amplitude goes along with a substantial increase of the mean water level in the upstream tidal river.
The expressions (A5) and (A6) show that the water level slope [math] \left\vert \Large{ \partial \zeta \over \partial x }\normalsize \right\vert [/math] is smaller during maximum flood flow [math]\theta=0[/math] than during maximum ebb flow [math]\theta=\pi[/math] . Assuming that the propagation speed of the tidal wave is the same at maximum flood flow and maximum ebb flow, then an observer at a fixed location will see a relatively slower water level rise at maximum flood flow and a relatively faster water level fall at maximum ebb flow. Water level records display the opposite behavior, as illustrated in Fig. 2: a faster water level rise (steep dipping wave front [math]\Large\frac{\partial \zeta}{\partial x}\normalsize \lt 0[/math]) and a slower water level fall (gently rising level behind the wave front [math]\Large\frac{\partial \zeta}{\partial x}\normalsize \gt 0[/math]). This behavior is due to the faster propagation (diffusion) speed of the high water (HW) wave crest relative to the low water (LW) wave trough. Two responsible effects are:
- The frictional retardation of the propagation speed is smaller at HW than at LW because the water depth [math]h[/math] is higher and the cross-sectional area [math]A[/math] greater at HW relative to LW;
- The HW propagation speed is enhanced by advection with the positive flood flow, while the LW propagation speed is retarded due to the opposing ebb flow.
These features are not included in the simplified equations (A2) and (A3). An explanation of the higher propagation speed of the HW tidal wave crest relative to the LW trough is given in appendix C and in the article Tidal asymmetry and tidal inlet morphodynamics.
Appendix B: Development of the friction term
The development of the friction term for [math]Q_1 \gt Q_0[/math] was given by Dronkers (1964[14]). In the case of a single harmonic tide [math]Q = -Q_0 + Q_1 \cos \theta[/math], the friction term is written as
[math]Q|Q| = Q_1^2 (\cos \alpha + \cos \theta) |\cos \alpha + \cos \theta|, \quad \cos \alpha = - Q_0/Q_1 \equiv -y. \qquad (B1)[/math]
The right-hand side can be developed into a sum of Chebyshev polynomials. A high degree of accuracy is achieved with only 4 terms. The final result is
[math] \Large\frac{ Q |Q| }{Q_1^2}\normalsize = f_0 + f_1 \cos \theta + f_2 \cos 2 \theta + f_3 \cos 3 \theta , \qquad (B2) [/math]
[math]f_0=d_0+ \frac{1}{2}d_2 - (d_1+ \frac{3}{2}d_3)y + d_2 y^2-d_3y^3, \; f_1=d_1 + \frac{3}{4}d_3 -2d_2y+3d_3y^2, \; f_2=\frac{1}{2}d_2-\frac{3}{2} d_3 y, \; f_3=\frac{1}{4}d_3. \qquad (B3)[/math]
The coefficients [math]d_0, d_1, d_2, d_3[/math] are given by
[math]d_0 = -\frac{7}{120} \sin 2 \alpha + \frac{1}{24} \sin 6 \alpha - \frac{1}{60} \sin 8 \alpha[/math]
[math]d_1 = \frac{7}{6} \sin \alpha - \frac{7}{30} \sin 3 \alpha - \frac{7}{30} \sin 5 \alpha + \frac{1}{10} \sin 7 \alpha[/math]
[math]d_2 = \pi - 2 \alpha + \frac{1}{3} \sin 2 \alpha + \frac{19}{30} \sin 4 \alpha - \frac{1}{5} \sin 6 \alpha[/math]
[math]d_3 = \frac{4}{3} \sin \alpha -\frac{2}{3} \sin 3 \alpha + \frac{2}{15} \sin 5 \alpha [/math]
Appendix C: Tidal asymmetry
Friction-dominance and [math]Q_0 \gt Q_1[/math] are assumed. According to (A1, A5) the tidal equations can be written as:
[math]b\Large\frac{\partial \zeta}{\partial t}\normalsize + \Large\frac{\partial Q}{\partial x}\normalsize = 0 , \quad Q^2 = \Large\frac{g \, b^2 (h+\zeta)^3}{c_D} \frac{\partial \zeta}{\partial x}\normalsize \normalsize . \qquad (C1)[/math]
Derivation of the second equation and substitution in the first equation gives
[math]\Large\frac{\partial \zeta}{\partial t}\normalsize = - \Large\frac{1}{b}\frac{\partial Q}{\partial x}\normalsize = D \, \Biggl(\Large\frac{\partial^2 \zeta}{\partial x^2}\normalsize + \Large\frac{3}{h+\zeta}\normalsize \Bigl(\Large\frac{dh}{dx}\normalsize +\Large\frac{\partial \zeta}{\partial x}\normalsize \Bigr) \Large\frac{\partial \zeta}{\partial x}\normalsize \Biggr) , \quad D = \Large\frac{g \, b \, (h+\zeta)^3}{2c_D \left \vert Q \right \vert}\normalsize. \qquad (C2)[/math]
Far upstream the variation of the water depth [math]h+\zeta[/math] along the tidal river is small ([math]\Large\frac{\partial \zeta}{\partial x}\normalsize \sim - \Large\frac{dh}{dx}\normalsize [/math]) if [math]Q_0[/math] is close to the mean river discharge. In this case the upstream propagation of HW and LW into the tidal river is approximately described by a diffusion equation with time-varying diffusion coefficient,
[math]\Large\frac{\partial \zeta}{\partial t}\normalsize = D \, \Large\frac{\partial^2 \zeta}{\partial x^2}\normalsize . \qquad (C3)[/math]
[The case where [math]Q_0[/math] is very different from the mean discharge is discussed in Kästner et al. (2019[1])].
Around high water (HW), the tidal component of the discharge is directed upstream, and around low water (LW), downstream. The total discharge [math]|Q|[/math] is thus larger around low water than around high water. This implies that the diffusion coefficient [math]D[/math] defined in Eq. (C2) is larger around high water than around low water. High water will thus diffuse faster upstream into the tidal river than low water, shortening the flood period relative to the ebb period. Since the ebb and flood tidal prisms are equal, the tidal component of the current must be on average stronger during flood than during ebb.
Assuming [math]|Q_1|\lt \lt |Q_0|[/math] and [math]a\lt \lt h[/math], Eq. (2) can be simplified to [math]D \approx \Large\frac{\omega}{2 k^2}\normalsize (1+ 3 \Large\frac{\zeta}{h}\normalsize)[/math], with [math]k = \sqrt{\Large\frac{c_D \omega Q_0}{g b h^3}\normalsize}[/math]. If we further assume that the mean depth [math]h[/math] is uniform, Eq. (C2) can be solved analytically up to order [math]O[(\large\frac{a}{h}\normalsize)^2][/math]:
[math]\zeta (x,t)=a e^{-kx} \cos(\omega t -kx) + \Large\frac{3 a^2}{4h}\normalsize \Big( e^{-\sqrt{2}kx} \cos(2 \omega t - \sqrt{2}kx) - e^{-2kx} \cos(2 \omega t -2kx) \Big) . \qquad (C4)[/math]
We consider the part of the tidal river where [math]kx \lt \lt 1[/math]. By expanding the expression (C4) around the phases of HW and LW, where [math]\partial \zeta / \partial t =0[/math], the upstream propagation speeds [math]c^+[/math] and [math]c^-[/math] can be derived of HW and LW respectively,
[math]c^{\pm} = \Large\frac{\omega}{k}\normalsize \Big(1 \pm \Large\frac{3a}{2h}\normalsize (2- \sqrt{2}) \Big) . \qquad (C5)[/math]
This expression also indicates flood dominance due to the higher propagation speed of HW compared to LW. Flood dominance also occurs in the downstream part of the tidal river and in the estuary, where the tidal component of the discharge is much larger than the fluvial component, see Tidal asymmetry and tidal basin morphodynamics. In fact, dominance of the maximum tidal discharge during flood over the maximum tidal discharge during ebb occurs over the entire range of tidal rivers where tidal propagation is strongly influenced by bottom friction.
Related articles
- Tidal rivers
- Estuarine turbidity maximum
- Morphology of estuaries
- Tidal asymmetry and tidal inlet morphodynamics
References
- ↑ 1.0 1.1 Kästner, K., Hoitink, A. J. F. T., Torfs, P. J. J. F., Deleersnijder, E. and Ningsih, N. S. 2019. Propagation of tides along a river with a sloping bed. Journal of Fluid Mechanics 872: 39–73
- ↑ 2.0 2.1 Pareja-Roman, L. F., Chant, R. J. and Sommerfield, C. K. 2020. Impact of historical channel deepening on tidal hydraulics in the Delaware Estuary. Journal of Geophysical Research: Oceans 125, e2020JC016256
- ↑ Talke, S. A., Familkhalili, R. and Jay, D. A. 2021. The influence of channel deepening on tides, river discharge effects, and storm surge. Journal of Geophysical Research: Oceans 126, e2020JC016328
- ↑ Winterwerp, J.C., Vroom, J., Wang, Z.B., Krebs, M., Hendriks, E.C.M., van Maren, D.S., Schrottke, K., Borgsmüller, C. and Schöl, A. 2017. SPM response to tide and river flow in the hyper-turbid Ems River. Ocean Dyn. 67:559–83
- ↑ Uncles, R. J., Stephens, J. A. and Law, D. J. 2006. Turbidity maximum in the macrotidal, highly turbid Humber Estuary, UK: Flocs, fluid mud, stationary suspensions and tidal bores. Estuarine, Coastal and Shelf Science 67: 30–52
- ↑ Burchard, H., Schuttelaars, H. M. and Ralston, D. K. 2018. Sediment trapping in estuaries. Annual Review of Marine Science 10: 371–395
- ↑ Winterwerp, J.C. 2013. On the response of tidal rivers to deepening and narrowing. Report for the Flemish-Dutch Scheldt Committee research program 'LTV Safety and Accessibility'.
- ↑ ABP mer (Whitehead, P.A. ed.) 2011. River Elbe River Engineering and Sediment Management Concept Review of sediment management strategy in the context of other European estuaries from a morphological perspective. Hamburg Port Authority (HPA) and Federal Waterways and Shipping Administration (WSA) Report R.1805
- ↑ 9.0 9.1 LeBlond, P. H. 1979. Forced fortnightly tides in shallow waters. Atmos.-Ocean 17: 253– 264
- ↑ LeBlond, P.H. 1978. On tidal propagation in shallow rivers. J. Geophys. Res. 83: 4714-4721
- ↑ Dronkers, J. 2017. Dynamics of Coastal Systems, 2nd ed. Advanced Series on Ocean Engineering 41. World Scientific Publ. Co., Singapore. 753 pp.
- ↑ Guezennec, L., Lafite, R., Dupont, J-P., Meyer, R. and Boust, D. 1999. Hydrodynamics of suspended particulate matter in the tidal freshwater zone of a microtidal estuary. Estuaries 22: 717-727
- ↑ Salomons, W. and Mook, W.G. 1981. Field observations of isotopic composition of particulate organic carbon in the Southern North Sea and adjacent estuaries. Mar.Geol. 41: 11-20
- ↑ Dronkers, J.J. 1964. Tidal computations in rivers and coastal waters. North Holland Publ. Co., Amsterdam, 518 pp.
Please note that others may also have edited the contents of this article.
|


